Strategy Tester Report
[ea]DailyHiLoFIB_Ron_MT4_v01a
AlpariUK-Demo (Build 225)
| Symbol | EURUSD (Euro vs US Dollar) | ||||
| Period | 1 Hour (H1) 2010.03.01 00:00 - 2010.03.26 21:00 (2010.03.01 - 2010.03.27) | ||||
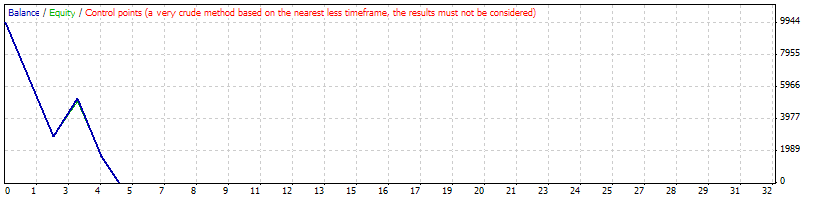
| Model | Control points (a very crude method, the results must not be considered) | ||||
| Parameters | ATRPeriod=0; ATRMultiplier=1; MartingaleStyle=0; Lots=5; StartingBalance=0; ProfitMade=0; BasketProfit=0; LossLimit=69; BasketLoss=0; BreakEven=0; TrailStop=34; LotResolution=1; KillLogging=false; | ||||
| Bars in test | 1474 | Ticks modelled | 12836 | Modelling quality | n/a |
| Mismatched charts errors | 8 | ||||
| Initial deposit | 10000.00 | ||||
| Total net profit | -10683.50 | Gross profit | 2316.50 | Gross loss | -13000.00 |
| Profit factor | 0.18 | Expected payoff | -2136.70 | ||
| Absolute drawdown | 10683.50 | Maximal drawdown | 12168.50 (105.95%) | Relative drawdown | 105.95% (12168.50) |
| Total trades | 5 | Short positions (won %) | 0 (0.00%) | Long positions (won %) | 5 (20.00%) |
| Profit trades (% of total) | 1 (20.00%) | Loss trades (% of total) | 4 (80.00%) | ||
| Largest | profit trade | 2316.50 | loss trade | -3620.00 | |
| Average | profit trade | 2316.50 | loss trade | -3250.00 | |
| Maximum | consecutive wins (profit in money) | 1 (2316.50) | consecutive losses (loss in money) | 2 (-7080.00) | |
| Maximal | consecutive profit (count of wins) | 2316.50 (1) | consecutive loss (count of losses) | -7080.00 (2) | |
| Average | consecutive wins | 1 | consecutive losses | 2 | |
| # | Time | Type | Order | Size | Price | S / L | T / P | Profit | Balance |
| 1 | 2010.03.01 00:00 | buy | 1 | 5.00 | 1.36242 | 0.00000 | 0.00000 | ||
| 2 | 2010.03.01 00:00 | modify | 1 | 5.00 | 1.36242 | 1.34552 | 0.00000 | ||
| 3 | 2010.03.01 12:45 | close | 1 | 5.00 | 1.35523 | 1.34552 | 0.00000 | -3595.00 | 6405.00 |
| 4 | 2010.03.01 12:47 | buy | 2 | 5.00 | 1.35610 | 0.00000 | 0.00000 | ||
| 5 | 2010.03.01 12:47 | modify | 2 | 5.00 | 1.35610 | 1.33920 | 0.00000 | ||
| 6 | 2010.03.01 16:15 | close | 2 | 5.00 | 1.34913 | 1.33920 | 0.00000 | -3485.00 | 2920.00 |
| 7 | 2010.03.01 16:17 | buy | 3 | 5.00 | 1.34997 | 0.00000 | 0.00000 | ||
| 8 | 2010.03.01 16:17 | modify | 3 | 5.00 | 1.34997 | 1.33307 | 0.00000 | ||
| 9 | 2010.03.01 18:50 | modify | 3 | 5.00 | 1.34997 | 1.35031 | 0.00000 | ||
| 10 | 2010.03.01 19:15 | modify | 3 | 5.00 | 1.34997 | 1.35061 | 0.00000 | ||
| 11 | 2010.03.01 19:20 | modify | 3 | 5.00 | 1.34997 | 1.35110 | 0.00000 | ||
| 12 | 2010.03.01 19:40 | modify | 3 | 5.00 | 1.34997 | 1.35155 | 0.00000 | ||
| 13 | 2010.03.01 19:45 | modify | 3 | 5.00 | 1.34997 | 1.35212 | 0.00000 | ||
| 14 | 2010.03.01 19:50 | modify | 3 | 5.00 | 1.34997 | 1.35269 | 0.00000 | ||
| 15 | 2010.03.01 20:20 | modify | 3 | 5.00 | 1.34997 | 1.35289 | 0.00000 | ||
| 16 | 2010.03.01 20:40 | modify | 3 | 5.00 | 1.34997 | 1.35336 | 0.00000 | ||
| 17 | 2010.03.01 20:45 | modify | 3 | 5.00 | 1.34997 | 1.35398 | 0.00000 | ||
| 18 | 2010.03.01 20:50 | modify | 3 | 5.00 | 1.34997 | 1.35461 | 0.00000 | ||
| 19 | 2010.03.02 01:45 | s/l | 3 | 5.00 | 1.35461 | 1.35461 | 0.00000 | 2316.50 | 5236.50 |
| 20 | 2010.03.02 01:45 | buy | 4 | 5.00 | 1.35447 | 0.00000 | 0.00000 | ||
| 21 | 2010.03.02 01:45 | modify | 4 | 5.00 | 1.35447 | 1.33757 | 0.00000 | ||
| 22 | 2010.03.02 10:10 | close | 4 | 5.00 | 1.34723 | 1.33757 | 0.00000 | -3620.00 | 1616.50 |
| 23 | 2010.03.02 10:12 | buy | 5 | 5.00 | 1.34799 | 0.00000 | 0.00000 | ||
| 24 | 2010.03.02 10:12 | modify | 5 | 5.00 | 1.34799 | 1.33109 | 0.00000 | ||
| 25 | 2010.03.02 10:20 | close at stop | 5 | 5.00 | 1.34339 | 1.33109 | 0.00000 | -2300.00 | -683.50 |